Before I will tell you how I want to describe to you why someone may need to use Kudu to get logs from Azure.
Of course, the best way to work with Sitecore logs (when it is installed as PaaS) is the Application Insights tool. But when it has to be disabled because of many different reasons we are forced to use good old files with logs.
An issue with log files is the fact that when a file is in use we cannot just download it from the server with FTP client because it is locked by IIS process. To access the latest data we must use Kudu tool – but it is not the most efficient way to find and open log file – especially when you have thousands of log files and Kudu does not allow us to sort the files by date to get that one you need.
How to find in Kudu lately updated files?
Let’s start with the opening of PowerShell tool in Kudu

Then by clicking or with command enter the directory with logs files.
cd "D:\home\site\wwwroot\App_Data\logs"As a result, you will see the list of files with pagination – it means that in case of having thousands of files – to find the file is a nightmare. Thanks to PowerShell console, we can find the name of a file very quickly.
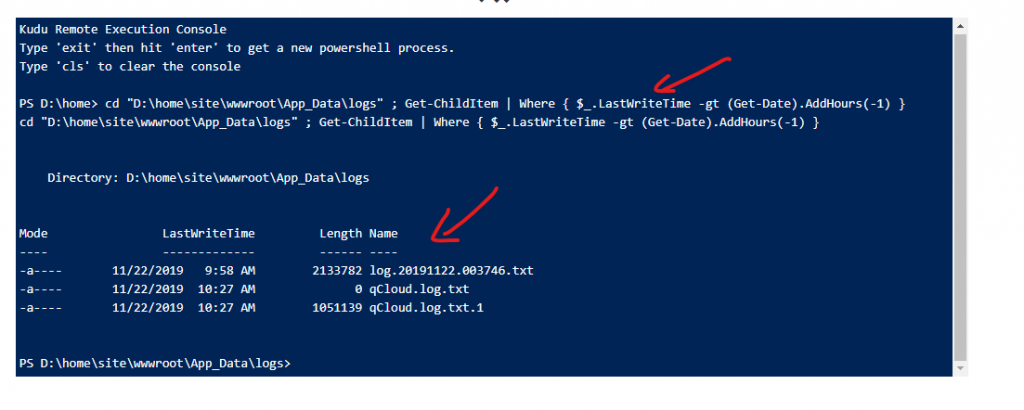
Run the following command to get files modified during last hour:
Get-ChildItem | Where { $_.LastWriteTime -gt (Get-Date).AddHours(-1) }(you can run two commands at once, just use a semicolon between two of them)
As a result, you will see in a PS console a list of files names:

Now, to get the file you have to use Kudu’s URL (copy it from the browser) – get only a domain, then add the following path to it, with name of your file at the end:
/api/vfs/site/wwwroot/App_Data/logs/nameOfYourFileIn total you should receive something like this:
https://domainWithSCMinIT/api/vfs/site/wwwroot/App_Data/logs/nameOfYourFile.txtOpen it in the browser to get the latest data from the currently used log file.
 I spent a few hours on searching for the solution. I tried solutions from